Introduction
Managerial finance plays crucial role in the company so that finance can be utilised in proper way and meeting operational requirements. Present report deals with two companies such as JD Sports Fashion Plc and Sports-Direct International Plc engaged in retail sector of sports products. Financial ratios are being computed for company to assess performance of both rivals. On the other hand, investment appraisal methods such as NPV, ARR and payback period are calculated which clarifies whether investment should be made or not. Thus, overall financial performance can be analysed with the help of such techniques in effective manner.
Assignment Prime is an online assignment writing service provider which caters the academic need of students.
Get Best Pricing Quotes Free Samples Email : help@assignmentprime.com Order NowPortfolio 1
Question 1
A) Computation of financial ratios of organisations
|
2015 |
2016 |
||||
|
Particulars |
Formula |
Sports Direct International Plc |
JD Sports Fashion Plc |
Sports Direct International Plc |
JD Sports Fashion Plc |
|
Current Assets |
878297 |
400259 |
1311437 |
510695 |
|
|
Current Liabilities |
382621 |
326748 |
540608 |
348154 |
|
|
Current Ratio |
Current assets / Current liabilities |
2.3 |
1.22 |
2.43 |
1.47 |
|
Current Assets |
878297 |
400259 |
1311437 |
510695 |
|
|
Current Liabilities |
382621 |
326748 |
540608 |
348154 |
|
|
Inventories |
517054 |
91024 |
702158 |
106336 |
|
|
Prepaid Expenses |
0 |
0 |
0 |
0 |
|
|
Acid Test Ratio |
Liquid assets / Current liabilities |
0.94 |
0.53 |
1.13 |
0.78 |
|
Gross Profit Margin |
1240812 |
739550 |
1284644 |
884221 |
|
|
Net Sales |
2832560 |
1522253 |
2904325 |
1821652 |
|
|
Gross Profit Margin |
Gross profit / net sales * 100 |
43.81% |
48.58% |
44.23% |
48.54% |
|
Operating Profit Margin |
8345 |
92646 |
11137 |
133406 |
|
|
Net Sales |
2832560 |
1522253 |
2904325 |
1821652 |
|
|
Operating Profit Margin |
Operating profit / net sales * 100 |
0.29% |
6.09% |
0.38% |
7.32% |
|
Net Profit Margin |
241353 |
53971 |
278981 |
100630 |
|
|
Net Sales |
2832560 |
1522253 |
2904325 |
1821652 |
|
|
Net Profit Margin |
Net profit / net sales * 100 |
8.52% |
3.55% |
9.61% |
5.52% |
|
Debt |
136849 |
374 |
333063 |
247 |
|
|
Equity |
1161551 |
309991 |
1384728 |
400825 |
|
|
Gearing Ratios |
Debt / Equity |
11.78% |
0.12% |
24.05% |
0.06% |
|
Income Available For Equity Stakeholders |
241353 |
53971 |
278981 |
100630 |
|
|
Outstanding Equity Shares |
9798931.8 |
2707185.36 |
13056310.8 |
3539157.1 |
|
|
Earnings Per Share (EPS) |
Income available for equity stakeholders / Outstanding equity shares |
2.46 |
1.99 |
2.14 |
2.84 |
|
Operating Profit |
8345 |
92646 |
11137 |
133406 |
|
|
Capital Employed (Total Assets – Current liabilities) |
1391062 |
354922 |
1819248 |
443142 |
|
|
Return On Capital Employed (ROCE) |
Operating profit / Capital Employed |
0.60% |
26.10% |
0.61% |
30.10% |
|
Cost Of Sales |
1591748 |
782703 |
1619681 |
937431 |
|
|
Average Stock |
517054 |
91024 |
702158 |
106336 |
|
|
Stock Turnover Period |
Cost of Sales / Average stock |
119 days |
43 days |
158 days |
41 days |
|
Dividend Paid |
0 |
13260 |
0 |
13820 |
|
|
Net Income Available To Equity Shareholders |
241353 |
53971 |
278981 |
100630 |
|
|
Dividend Payout Ratios |
Dividends / Net income available to equity shareholders |
0.00% |
24.57% |
0.00% |
13.73% |
B) Analyse financial performance of companies
Financial ratios are quite helpful in determining performance of the company in that way by which improvement if any required can be made by interpreting results in the best possible manner (Arena and Ferris, 2017). It can be said that computation of ratios are beneficial for organisation so that necessary improvements may be easily done and as such, financial condition can be enhanced with much ease. In relation to this, financial ratios for JD Sports Plc and Sports-Direct International Plc have been calculated for the period of two years ie 2015 and 2016.
Current Ratio
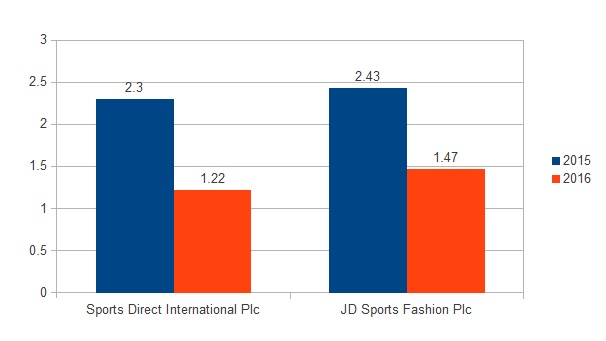
Illustration 1: Current ratio
Current ratio of both companies have been computed for two periods. It shows how much assets company has to effectively fulfil liabilities which becomes liquid within one year. Thus, short-term liabilities are to be paid from the current assets. The ideal current ratio is 2 : 1 as recommended by the market experts. It can be analysed that JD Sports Fashion Plc had 1.22 and 1.47 respectively in financial years 2015 and 2016. On the other hand, current ratio of Sports-Direct International Plc had 2.3 and 2.43 in past two years. It clearly shows that Sports-Direct International Plc has effective ratio which is more than ideal one as well. JD Sports Fashion Plc has to improve upon its current ratio so that liabilities can be met within time frame.
Acid Test Ratio
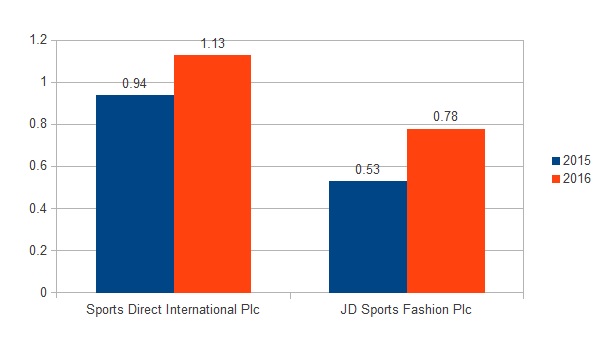
Illustration 2: Acid test ratio
Acid Test ratio is further extension of above discussed ratio as it implies whether liabilities can be paid within extreme liquid assets falling in one year. Here, extreme liquid assets means that by subtracting prepaid expenses and inventories from current assets. Thus, residual left after such subtraction is known as liquid assets. It can be interpreted that JD Sports Fashion Plc has 0.53 and 0.78 ratio in both years. While, other organisation has 0.94 and 1.13 in 2015 and 2016. It shows that JD Sports Fashion Plc has to improve upon acid test ratio (Jackowicz, Mielcarz and Wnuczak, 2017).
Gross Profit Margin
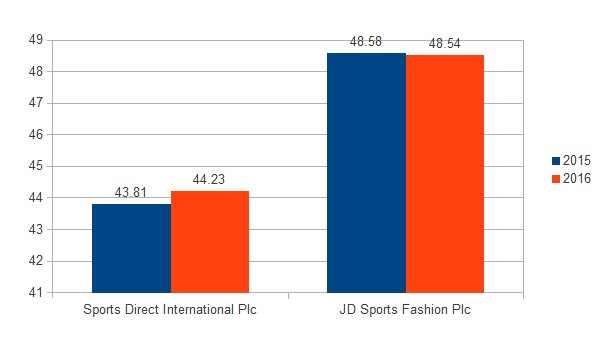
Illustration 3: Gross profit margin
This is a ratio that pertains to profitability aspect of the population in effective way. Gross profit margin shows whether company has enough gross margin after reducing cost of sales from revenue. If expenses are more than it is required to initiate control over the same so that desired profit can be attained. It can be interpreted that Sports-Direct International Plc had 43.81 % in 2015 and 44.23 % in next year. On the other hand, JD Sports Fashion Plc had 48.58% and 48.54 % in two years respectively (Diltz and Rakowski, 2018). This shows that latter company has effective gross profit margin. While, former organisation has to reduce expenditures for attaining more income.
Operating Profit Margin
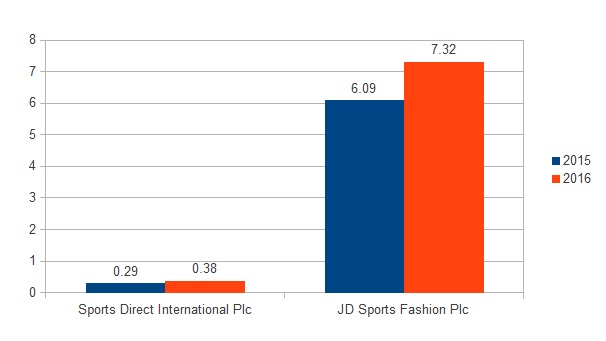
Illustration 4: Operating profit margin
This is another ratio which shows profit left after deducting operational expenses in the best possible manner. More the amount, better for organisation. It can be interpreted that JD Sports Fashion Plc had 6.09 % and 7.32 % in past couple of years while Sports-Direct International Plc operating ratio is much lower as it was 0.29 % and 0.38 % in two periods. However, ratio of both organisations are declined but JD Sports Fashion Plc has more ratio in comparison to other firm (Chen, 2017).
Net Profit Margin
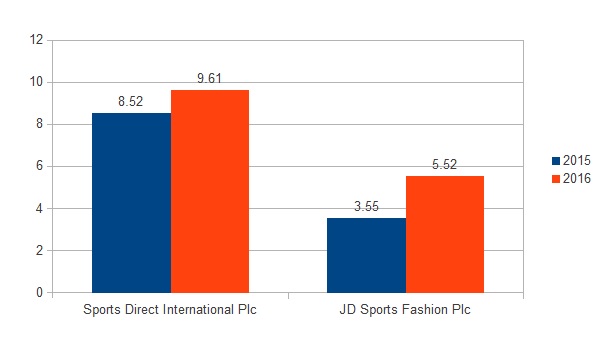
Illustration 5: Net profit margin
Net profit is attained after deduction of all expenditures of company. This ratio shows that how company is garnering profit by incurring costs. It can be analysed from the computation that JD Sports Fashion Plc had 3.55 % and 5.52 % in 2015 and 2016 respectively. On the other hand, Sports-Direct International Plc had 8.52 % and 9.61 % in the same periods. This clearly implies that net profit margin of JD Sports Fashion Plc is poor and needs to control upon expenses for improving financial condition (Cox, 2017).
Gearing Ratios
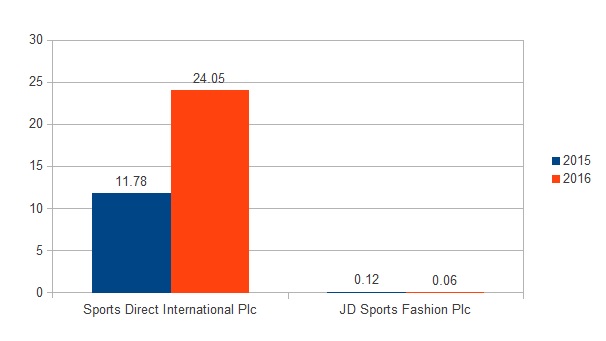
Illustration 6: Gearing ratio
The gearing ratio is another important for the company as solvency position is assessed in effective manner. The ideal gearing ratio is below 50 % which means that company should have balanced use of debt in comparison to equity (Hamdi and Majdoub, 2018). Thus, it can be analysed from the computation that Sports-Direct International Plc had 11.78 % and 24.05 % in two years. While, JD Sports Fashion Plc had 0.12 % and 0.06 % in past years. This shows that company is required to increase use of debt as equity is financed up to a high extent.
Earnings Per Share
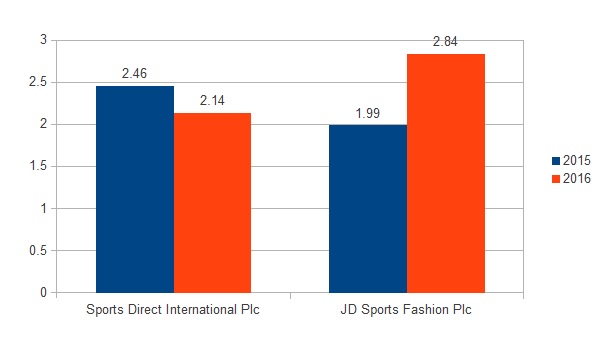
Illustration 7: EPS
EPS is termed as earnings attained by company on per shares. This ratio is quite helpful for organisation to analyse how much income is generated from the market which is again useful for shareholders as dividends depend upon profits made by company. It can be interpreted that JD Sports Fashion Plc had 1.99 % and 2.84 in 2015 and 2016. On the other hand, Sports-Direct International Plc had 2.46 % and 2.14 % in same years. This shows that EPS of organisations are low and as such, per share earnings has to be increased.
Return On Capital Employed (ROCE)
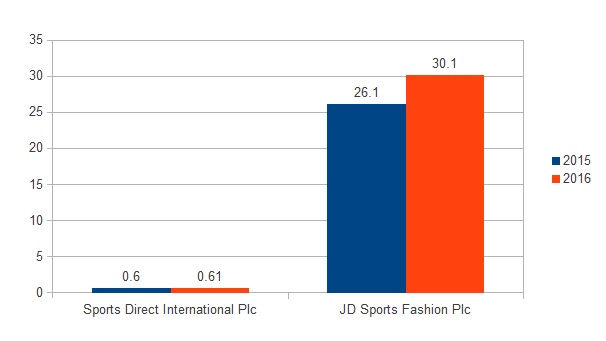
Illustration 8: ROCE
ROCE is quite effective financial ratio as it provides clarity whether company is effectively utilising investment of shareholders for producing sales or not (Gill and Biger, 2013). This is essential as shareholders invests with a view to get higher returns in the form of dividends. It can be analysed that Sports-Direct International Plc had 0.60 % and 0.61 % in 2015 and 2016 respectively. On the other hand, JD Sports Fashion Plc's ROCE was 26.10 % and 30.10 % which shows that organisation is effectively using shareholders' investment to generate sales.
Stock Turnover Period
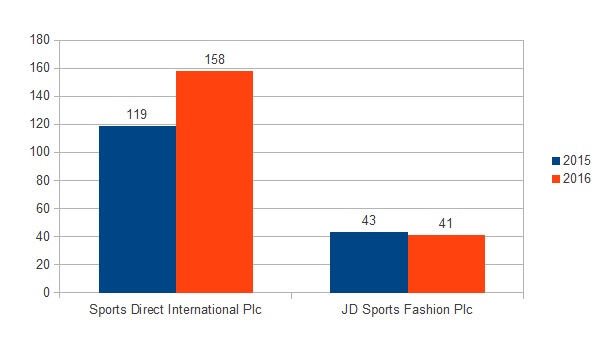
Illustration 9: Stock turnover period
The stock turnover ratio is another effective ratio showing how quickly inventory is being used and replenish in the best possible manner. This is useful ratio as it shows whether production is quickly achieved by the company by utilising stock in effectual way. This ratio is computed in days for both organisations. Lesser the days, more efficiency of firm can be observed. It can be interpreted that Sports-Direct International Plc had 119 days in 2015 and 158 days in next year. While, JD Sports Fashion Plc had 43 days and 41 days in couple of years. This shows that stock is replenished in effective manner by firm. Sports-Direct International Plc has to improve upon ratio by utilising inventory at the earliest.
Dividend Payout Ratio

Illustration 10: Dividend payout ratio
This ratio is useful for shareholders so that they may take decision whether to invest in the company or not. This decision is made by assessing how many dividends are paid by the firm. It can be seen from the dividend payout ratio JD Sports Fashion Plc had ratio of 24.57 % and 13.73 % in 2015 and 2016 which means that ratio is decreased in 2016 year. On the other hand, other organisation had paid no dividends and as such, ratio is zero as well. This is not good for the company as shareholders' will no longer invest in the firm. Thus, dividends has to be paid by Sports-Direct International Plc to shareholders by increasing its net profits (Dawar, 2014).
C) Suggestions to initiate improvement for poor performing company
The financial ratios are computed for both organisations in terms of profitability, liquidity, solvency, efficiency and investment. It can be interpreted that Sports-Direct International Plc has poor or low performance in comparison to JD Sports Fashion Plc. Therefore, following suggestions can be given to firm so that financial condition may be improved up to a high extent.
- Gross profit needs to be improved by reducing uncessary expenditures which provides nothing in return but increases costs of company. Thus, eradicating unwanted expenses, profitability position can be enhanced in a better way.
- Operating profit ratio is low in comparison to its rival and as such, it has to improve upon the same for generating more operating income. It can be done by reducing operational expenses and increasing performance in effective manner (Darmadi and Gunawan, 2013).
- On the other hand, ROCE is an important ratio from the point of view of customers. It is suggested that ratio is around 0.60 % which is very poor as rival has more than 26 % in 2015 and 30.10 % in 2016. Thus, it is suggested to utilise investment made by shareholders so that sales can be injected up too much extent.
- Stock turnover ratio in days is more which is not good for the company. Inventory is not properly used by Sports-Direct International Plc and hence, it is required that organisation should improve upon ratio by quickly replenishing stock and use the same for meeting out production.
- Furthermore, dividend payout ratio is zero in both years which is not good for the company as shareholders' will lose trust on organisation and investment will not be made by them. Thus, it is required to increase earnings so that dividends may be paid to them in the best possible manner.
D) Limitations of financial ratios
The limitation of ratios are listed below-
- Quantitative information is taken into account by the firm while computing ratios. Thus, qualitative information should be considered which is ignored by ratios and as such, financial performance cannot be evaluated by relying only on quantitative information.
- Ratios provide information regarding performance of company be it poor or not. It does not impart reasons why performance is low which is the biggest limitation (Dimitropoulos, Vrondou and Avgerinou, 2018).
- Historical data is considered by seeking financial statements. Thus, both companies cannot make predictions and estimations for the future as ratios are computed on past year data.
- Another limitation of financial ratios is that when two companies follows different accounting policies, and prepares financials, then comparison cannot be made of organisations as ratios does not consider accounting policies while calculating the same.
Portfolio 2
Question 2
A) Investment appraisal techniques and suggestions to management of entity
Machinery 1
|
Year |
Net Profit (Machinery 1) |
Depreciation |
Net Cash Flows |
Present Value Factor @ 20% |
Discounted Cash Flow (DCF) |
|
2017 |
65000 |
25000 |
90000 |
0.833 |
74970 |
|
2018 |
65000 |
25000 |
90000 |
0.694 |
62460 |
|
2019 |
65000 |
25000 |
90000 |
0.579 |
52110 |
|
2020 |
55000 |
25000 |
80000 |
0.482 |
38560 |
|
2021 |
55000 |
25000 |
80000 |
0.402 |
32160 |
|
2022 |
45000 |
25000 |
70000 |
0.335 |
23450 |
|
Total DCF |
283710 |
||||
|
Initial Investment |
170000 |
||||
|
NPV |
113710 |
Calculation of Payback period
|
Year |
Net Cash Flows |
DCF |
|
2017 |
90000 |
90000 |
|
2018 |
90000 |
180000 |
|
2019 |
90000 |
270000 |
|
2020 |
80000 |
350000 |
|
2021 |
80000 |
430000 |
|
2022 |
70000 |
500000 |
|
Payback period |
1.9 years |
Calculation of ARR
|
Year |
Cash Flows |
|
2017 |
65000 |
|
2018 |
65000 |
|
2019 |
65000 |
|
2020 |
55000 |
|
2021 |
55000 |
|
2022 |
45000 |
|
350000 |
|
|
Average profit |
58333.3333333333 |
|
Average investment (170000 + 20000 / 2) |
95000 |
|
ARR |
61.40% |
Machinery 2
Calculation of NPV
|
Year |
Net Profit (Machinery 2) |
Depreciation |
Net Cash Flow |
Present Value Factor @ 20% |
Discounted Cash Flow (DCF) |
|
2017 |
25000 |
28333 |
53333 |
0.833 |
44426.389 |
|
2018 |
35000 |
28333 |
63333 |
0.694 |
43953.102 |
|
2019 |
45000 |
28333 |
73333 |
0.579 |
42459.807 |
|
2020 |
75000 |
28333 |
103333 |
0.482 |
49806.506 |
|
2021 |
85000 |
28333 |
113333 |
0.402 |
45559.866 |
|
2022 |
65000 |
28333 |
93333 |
0.335 |
31266.555 |
|
Total discounted cash inflow |
257472.225 |
||||
|
II |
170000 |
||||
|
NPV |
87472.225 |
Calculation of Payback period
|
Year |
Net Cash Flows |
DCF |
|
2017 |
53333 |
53333 |
|
2018 |
63333 |
116666 |
|
2019 |
73333 |
189999 |
|
2020 |
103333 |
293332 |
|
2021 |
113333 |
406665 |
|
2022 |
93333 |
499998 |
|
Payback Period |
2.6 years |
Calculation of ARR
|
Year |
Cash Flows |
|
2017 |
25000 |
|
2018 |
35000 |
|
2019 |
45000 |
|
2020 |
75000 |
|
2021 |
85000 |
|
2022 |
65000 |
|
330000 |
|
|
Average profit |
55000 |
|
Average investment (170000/2) |
85000 |
|
ARR |
64.71% |
It can be interpreted from above calculation of investment appraisal techniques that Machinery 1 should be implemented by the company as it is much fruitful for it. The appraisal techniques such as NPV, payback period and ARR are being calculated for each of the machineries. It can be analysed that Project A relates to Machinery 1 and Project B relates to Machinery 2. NPV of Project A is 113710 and of other one is 874272 which clearly shows that company should invest in former one as NPV is higher and it is recommended by market experts that if a project has higher NPV, organisation should invest in it as favourable returns will be achieved in near future. It is beneficial for company as higher profits would be attained in the best possible manner (Buchman, Harris and Liu, 2016).
On the other hand, payback period is calculated as well which shows how much time will be taken by the project to cover initial cost and generate returns. Shorter the payback period, more beneficial for company as in less time frame, returns may be produced. It can be analysed that Project A has 1.9 years of period while, Project B has 2.6 years. This clearly shows that Project A should be taken by organisation as payback period is less. ARR is computed which implies that how much return company will get on annual basis. It shows that ARR of Project B is more in comparison to Project A. However, overall profitability of Project A is good and investment should be made in the same.
B) Limitations of investment appraisal methods to aid in long-term decision-making
The limitation of investment appraisal methods are as follows-
- NPV
This method is useful for analysing profitability aspect of the project. However, when two projects are of different size and time duration and as such, it is the biggest limitation of NPV. Moreover, this method draws results on the basis of discounting rate which is difficult to calculate in real life. Another demerit of NPV is that when there are two projects and have unequal size, comparison becomes difficult. Thus, this method have drawbacks and not useful for company to rely upon (Delen, Kuzey and Uyar, 2013).
- ARR
It is calculated to assess average return that will be generated by company in the future. However, it has certain limitations as well. One of the main limitation of this that it does not take into account time value of money which is an important concept ignored by ARR. Another disadvantage of this method is that information is used from income statement and cash flows are ignored which means that inaccurate results are drawn. Moreover, it is useful only when investment is fully made in particular project. In simple words, when amount of investment is made in instalments, ARR is not suitable.
- Payback Period
It shows how much time project will take to provide desired results. One of the major limitation of this method is that profitability aspect of the project is not taken into account and only focus is made on time factor only (Limitations of financial ratios, 2017). This leads to inaccurate results and better decision cannot be made. Liquidity factor of new project is only taken into account and how many returns will be generated by project is ignored which is a crucial aspect. On the other hand, another demerit is that all the cash flows are not considered. In simple words, cash flows before computation of payback period is considered but after calculation, cash flows occurred are not taken into account which leads to improper conclusions.
Conclusion
Hereby it can be concluded that organisation is benefited by using financial ratios. This is evident from the fact that firm assess what more improvements need to be done so that financial health may be enhanced in a better way. It can be analysed that performance of Sports-Direct International Plc is poor in comparison to JD Sports Fashion Plc. Thus, suggestions have been provided to improve upon the same. On the other hand, investment appraisal techniques are quite useful in determining whether investment should be made in particular project or not.
References
- Arena, M. and Ferris, S., 2017. A survey of litigation in corporate finance.Managerial Finance.43(1). pp.4-18.
- Buchman, T. A., Harris, P. and Liu, M., 2016. GAAP vs. IFRS Treatment of Leases and the Impact on Financial Ratios.
- Chen, L., 2017. Managerial incentives, R&D investments and cash flows.Managerial Finance.43(8). pp.898-913.
- Cox, J. S., 2017. Managerial ability, growth opportunities, and IPO performance.Managerial Finance.43(4). pp.488-507.

UPTO50%
Avail The Benefit Today!
To View this & another 50000+ Free Sample