Introduction
Financial analysis evaluate business, economic trend, building financial policy, long term goals investors will examine a company's financial statement, income statement, balance sheet, cash flow statement (Karanina, Bykova and Ilysheva, 2014). Financial ratios are used to evaluate it performance as compared to other company financial analysis will provide best project for the companies. To evaluate the financial statements, financial statements of Farson and Heineken are taken. these company’s ideals in providing best beers and brewers to its consumer's and its clients. these companies have created market in local as well as international platform. This report will include the financial ratios of both the companies, along with vertical, horizontal analysis, further for making decision, importance of analysing of the working capital. Finally, report will include a critical analysis of annual cash flow statements of both the company for two years, finding will be accurate for making better decision for the firm.
Assignment Prime is an online assignment writing service provider which caters the academic need of students.
Get Best Pricing Quotes Free Samples Email : help@assignmentprime.com Order Now1. Financial Performance Analysis
Overview of Farsons
Farsons group established in 1928, since then group is engaged in the brewing of beers and beverages. it also involves in production and sale, distribution of beverages (Zeghal and El Aoun, 2016). In the competitive environment where the world’s leading food and beverage are competitive with each other, Farsons is committed to hold highest product standards and services in the portfolio, as a leading group of companies with an annual turnover in excess of euro 95 million. The group also focuses on innovation and export of beverages including wines and spirits will also help in ongoing growth and success. The aim of organisation is to grow both on local as well as on international business, with investment in million Farsons is ensuring its clients and consumer gets best quality standard beer with new beverage packing facility. It focuses on providing better quality of beverage to gain loyalty from consumers and to build meaningful partnership with other competitive brands to enhance its business.
Overview of Heineken
Heineken is the world's leading portfolios of beer brands and is one of the world's leading brewers in terms of sales volume and profitability. It includes more than 200 international premiums, regional, speciality beers. It has a good network of distribution beer and breweries, Heineken is giving good competition in domestic as well as international market with world class brands of beer and brewers for its customers and for clients. With variety of cocktail and brewers and of beer consumer is enjoying their times. Heineken is taking over the market of brewers by providing better quality beer to it consumer and client. it has capture local and international market by distributors of beer and brewers to its clients (Farrell and Gallagher, 2015).
Assessment of financial performance of Farsons
Vertical analysis
A form of analysis that involves report of profits and loss and financial position statement of organisation. All revenue report numbers are separated by the sales number so the revenue statement estimates are sales figures. All the elements of financial position statements are split by total assets of organisation in order to transform the figures of financial position statements into percentages of figures of total assets (Bekele, 2016).
Income statement
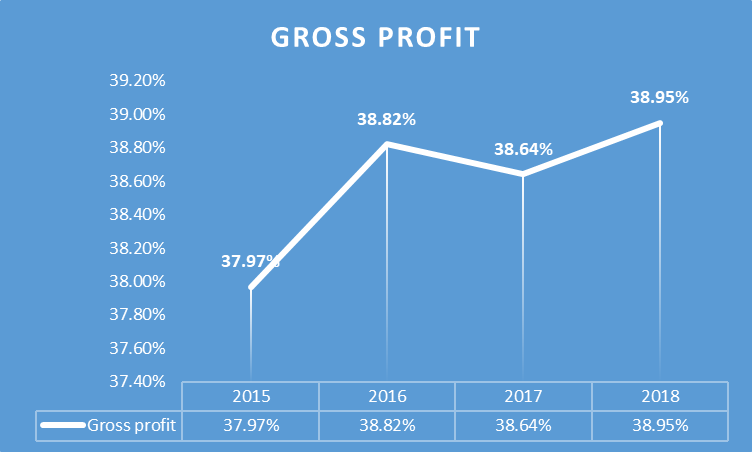
Based on the vertical assessment of Farsons ' income statement, it was estimated that the gross margin of the firm was 37.97 percent in 2015, that was boosted to 38.82 percent in 2016 or 38.64 percent or 38.95 percent in both in 2017 and 2018 (Muscat, 2013).
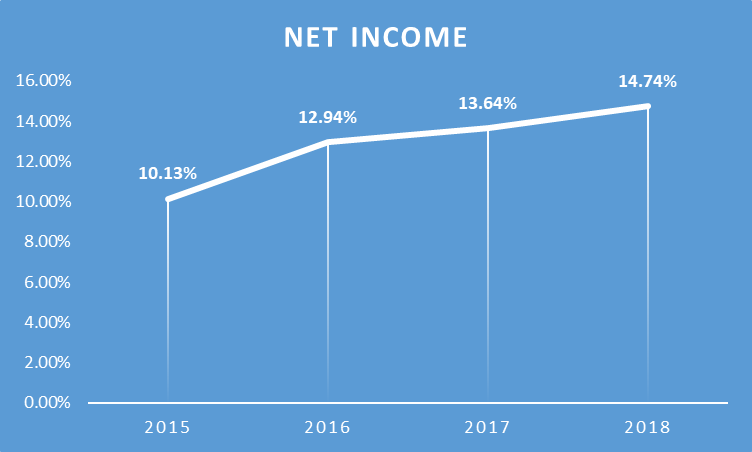
The net profit of the business was 14.74% of overall sales, which was 10.13%, 12.94% but 13.64% collectively in 2015, 2016 and 2017. This demonstrates that the capacity to generate net income for the company has been risen.
Financial position statement
The analysis of financial position statement of Farsons Plc vertically is carried out in order to determine the variations form the year 2015-2018.

The above graphical presentation reflects the variations among the current assets. Total assets are considered as a baseline for analysing the changes in (%). The graph states that current assets of company started decreasing form 2015. The current assets were 21.48% of total assets in 2015, 20.25% in the year 2016, 18.58% in 2017. After 2017 an increase of current assets recorded with 22.22%. the aggregate variation is calculated 0.25% increase in current assets. Overall it presents a favourable change in terms of current assets (Van Cranenburgh and Arenas, 2014).
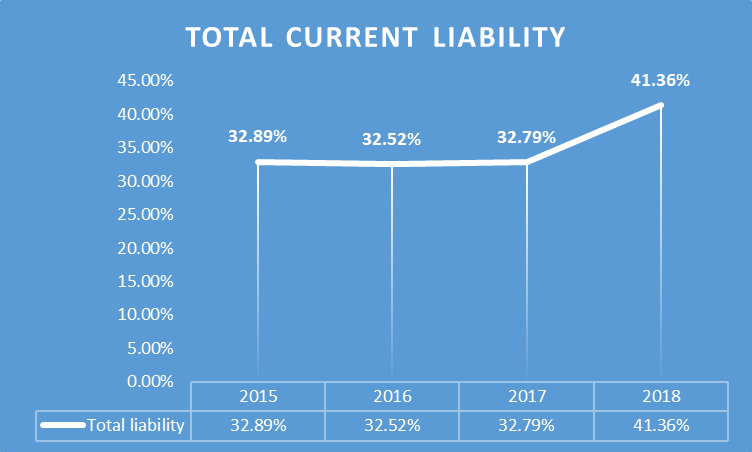
The above evaluation presents the variation among current liabilities of organisation from 2015 to 2018. Total liabilities of the same year are considered as a baseline to calculate variations in percentages. As the graphical presentation presents a moderate change in current liabilities from 2015 to 2017 and then after the increase recorded with 41.36% for 2018. The aggregate change in current liabilities is recorded as 2.25% increasing (Grixti, 2013).
Horizontal analysis
This is the analysis of financial statements that contains the comparison of the financial proportions for a particular accounting period. this analysis mainly helps in differentiate the data of financial statements with type of amounts in near future (Gatzert and Martin, 2015). The evaluation helps in categorising the data for short duration and assist the further analysis by considering previous year as a baseline.
Income statement
The evaluation of income statement of Farsons plc form 2015-2018 done below horizontally. 2015 is assumed as a base year to analyse the changes for succeeding years.
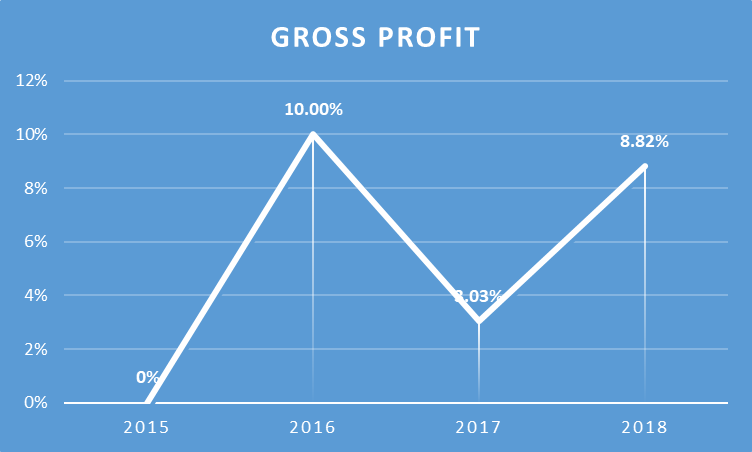
The above graph extracts the gross profit variations and clearly states that G.P. increased by 10% from 2015 to 2016, due increase in cost of sales and 2.03% in 2017 and then it 8.82% for 2018 (Azzopardi and Cortis, 2013).
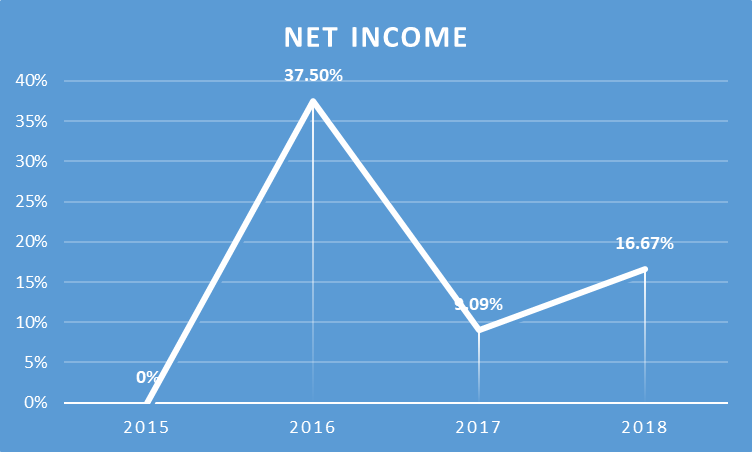
The above graphical presentation reflects the variation among net profitability of Farsons group form the year 2015 to 2018. It is analysed that that net profit for 2016 increased by 37.5% than increased by 9.09% and then increased by 16.67%. comparatively to four-year net profit was increased with higher rate in 2016. The aggregate incremental changes of four years in net profit counted as 5.6%. So, this is how gross and net profit of Farsons varied.
Financial position statement
The assessment of financial position statement mainly analysed horizontally from 2015-2018. Financial figures of 2015 is considered as base year for organisation.
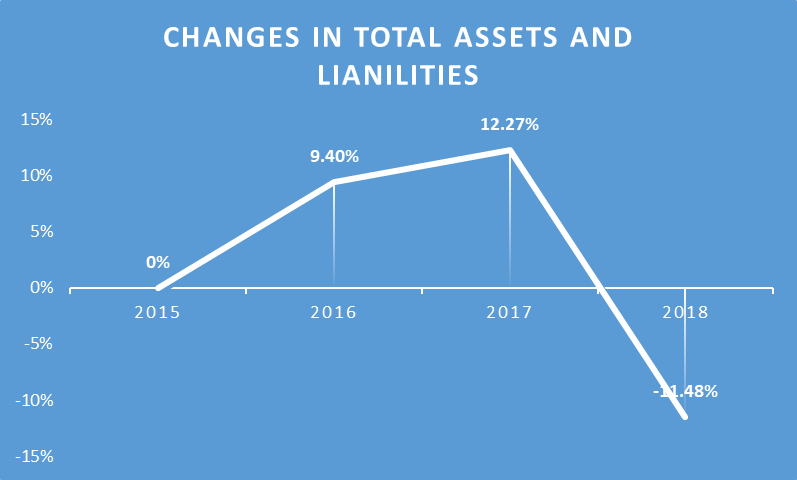
The above graphical presentation reflects the changes in total assets and liabilities for among the year 2015-2018. There is an increase of 9.40% recorded for the year 2016, 12.27increase for 2017 and then a huge decrease recorded in 2018 of 11.48%. the reason of this difference is anticipated of repayment of long-term liabilities. the aggregate changes for 2015-2018 was recorded as -3.83% (Crispim, 2018).
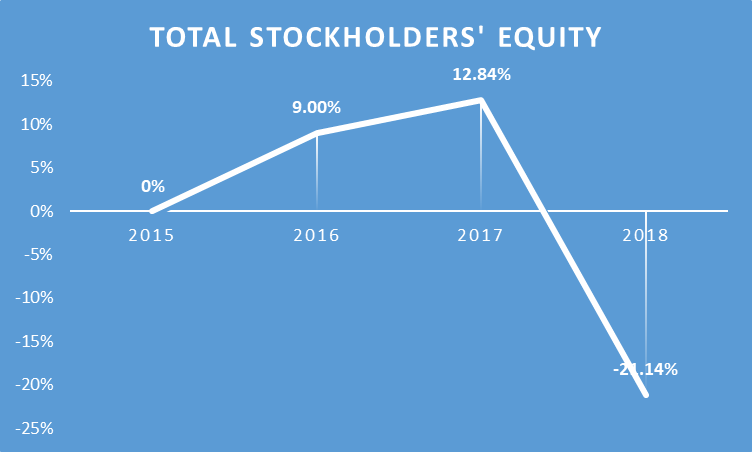
The above horizontal graphical presentation states the variations among the total stockholder’s equity for four years from (2015-2018). The graphical presentation of stockholder’s analysis clearly defines that equities and reserves increased for the year 2016 that boosted the overall stockholder’s value by 9% for 2016, 12.84% for 2017. In 2018 there is a huge deficiency recorded in terms of repayment of long term liability comparatively to 2017. This led the organisation down by -21.14%. In aggregate total stockholder’s changed -7.05% for four years.
Assessment of financial performance of Heineken
The Heineken financial performance is assessed by comparing the financial statements vertically and horizontally. Main objective of this assessment is to calculate overall performance and variations among the financial performance of Heineken. During four years (2015-2018).
- Vertical analysis
- Income statement
While calculating the variations among income statement of Heineken, gross profit and net profit is taken in consideration.
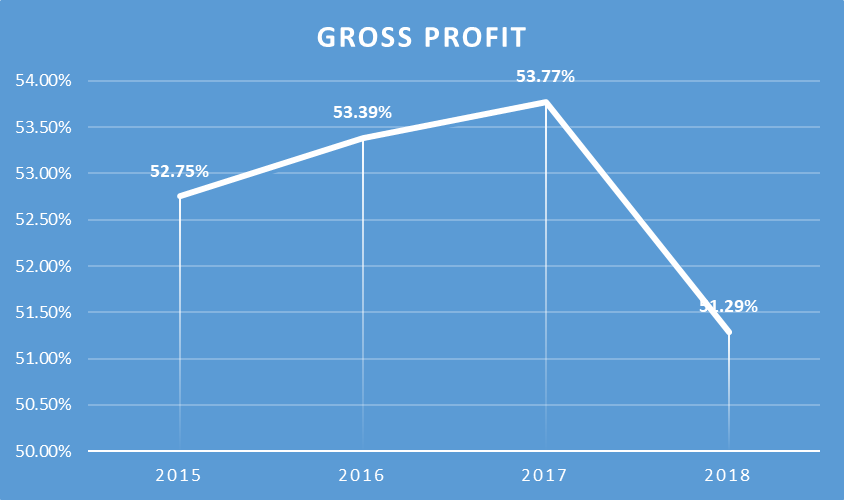
The above graph presents the percentage change in gross profit of Heineken during the year 2015-2018. The increasing trend clearly states that net profit for the subsequent three years get increased by 52.75%, 53.39%, 53.77% for 2015, 2016 and 2017. There is a downfall recorded for the year 2018 due to having low profits. Gross profit only grows by 51.29% for the year 2018. The reason of low growth in gross profit for the year is recognised increase in cost of sales for the year 2018.
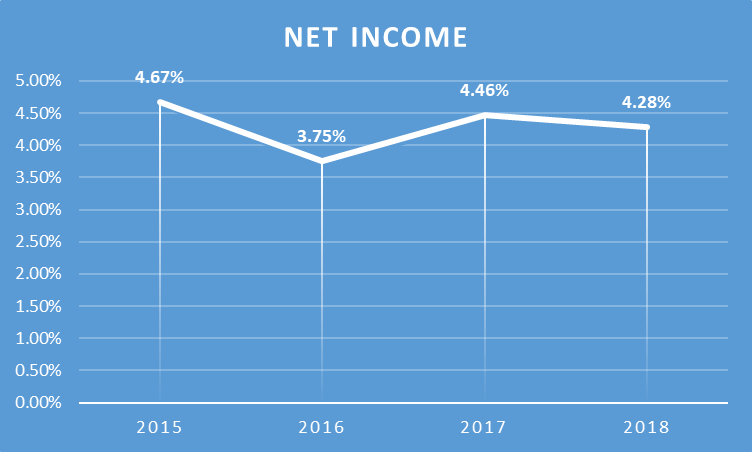
The above graph reflects the net income variation during the year 2015-2018. It is analysed that the net profit position of organisation was quite fluctuating as the net profit grew by 4.67% in 2015, 3.75% in 2016, 4.46% in 2017 and 4.28% in 2018. the aggregate change in profitability net profitability of organisation during 2015-2018 recorded as -0.13%.
Financial position statement
The balance sheet figures are evaluated vertically four years 2015-2018. The total assets and total liabilities and stockholder’s funds are taken as baseline of same year. Variations among current assets and change in current assets are analysed in the below information.
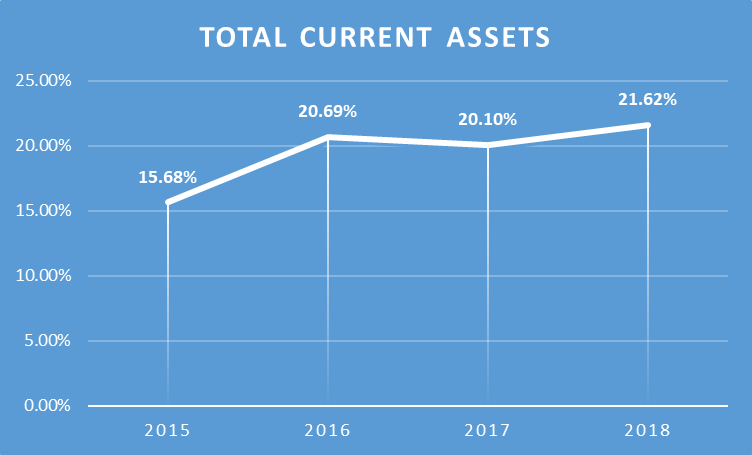
The above graphical interpretation indicates the fluctuations among the current assets. It is analysed that current assets for the year 2015 were 15.68% and then it was recorded by 20.69% of total liability. The variation among 2015 and 2016 recorded of 5.01% upwards in current assets. The level of current assets for 2017 and 2018 recoded as 20.10% and 21.62% subsequently. Comparatively current assets for the year 2017 decreased by -0.59% form 2016 and increased by 1.52% for the year 2018. Overall an aggregate increased by 1.98% for four years.
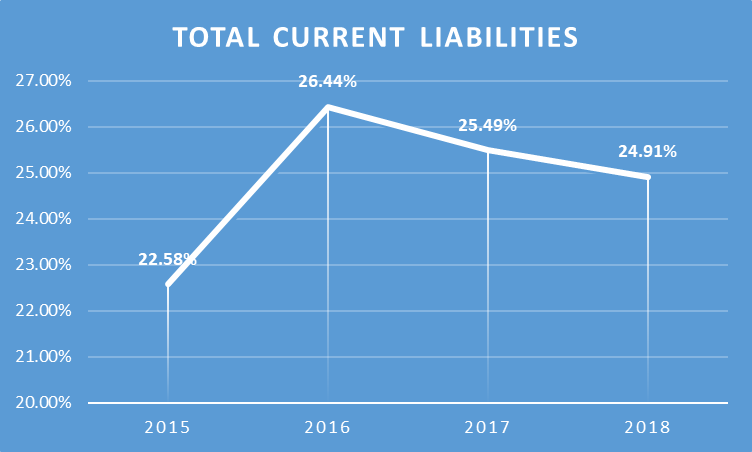
The above analysis displays the data related to variations among current assets. The evaluation clearly states that current assets for the year 2016 increased by 3.86% form the year 2015 and the current year in 2017 and 2018 were recorded as 25.49% and 24.91%. a negative change in current assets during the year 2017 and 2018 subsequently recorded as -0.95% and -0.58%. an aggregate change in current assets during four years (2015-2018) is recorded as 0.78%.
Horizontal analysis
The horizontal analysis of income statement and financial position statement of the Heineken is recorded for 2015 – 2018. In this analysis the financial data of 2015 is reckoned as base year in order to analyse the variation for upcoming three years.
Income statement
The income statement is analysed in terms of determining the variations during the year 2015-2018.
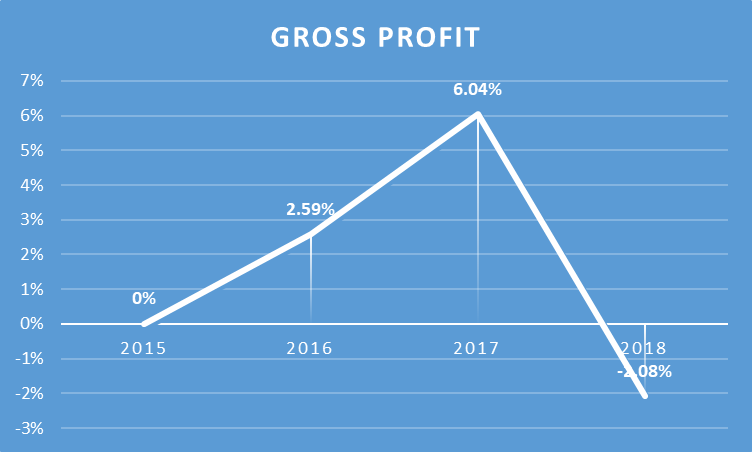
The above gross profit analysis states that the variations during the year 2015-2018 as the profit for year 2016 increased by 2.59%, 6.04% for 2017. After it there is a huge decrease recorded in terms of gross profitability during 2018. The gross profit of organisation decreased by -2.08%. As the aggregate variance during the year 2015 – 2018 recorded as -0.49%.
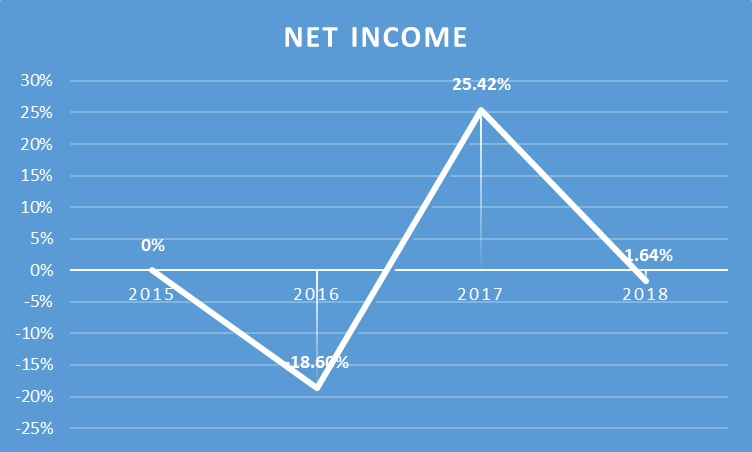
The above evaluation states the variation among net income of Heineken for the year 2015 – 2018. There is a shifting net income position is recorded during the year 2015 - 2018. It is recognised that the net income decreased by -18.60% and then it increased by 25.42% in 2017. The difference between the growth of net income from 2016 to 2017 recorded as 44.02%. Net income decreased by -1.64% in 2018 and the difference between the growth rate of net income from 2017 to 2018 recorded -27.06%.
Financial position statement
The below analysis clearly states the changes among total assets and total liabilities during 2015 – 2018. The horizontal financial position statement of Heineken is carried out by considering 2015 base year.
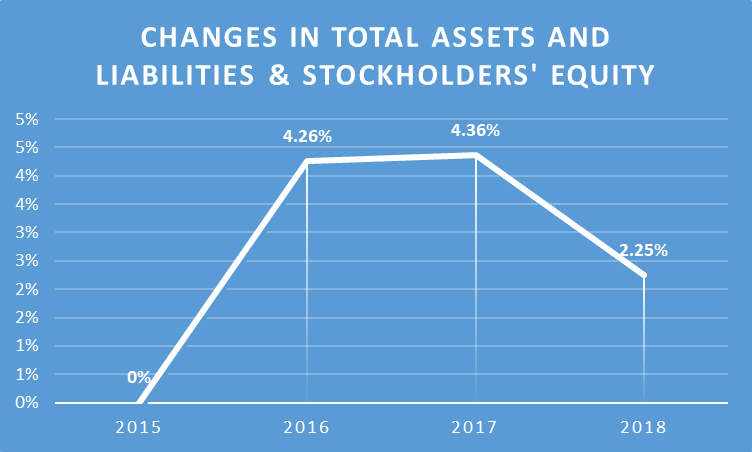
Above change in total assets and liabilities and stockholder’s analysis of equity states the changes in total assets. In horizontal analysis the variation among total assets and liabilities are recognised same. It is recorded that the total assets and liabilities and stockholder’s equity increased by 4.26%. in 2016, 4.36% in 2017. It increased by 2.25% in 2018. The reason of slow growth in 2018 is deficiency in long term liability and repayment of loans. An average increasing rate is calculated as 0.75%.

The above graph presents the analysis of difference and variations among total stockholder’s value. It is recorded that the change in total stockholder’s value was recorded as -2.25% for 2016, 0.53% for 2017 and it increased with high increased rate of 7.91%. it is evaluated that the change in equity mainly increased due to increase in equity share capital. The aggregate change was recorded as 2.68% that means the stockholder’s value increased by the 2.68% during four years.
Ratio analysis
Gross profit ratio
|
Farsons |
Heineken |
|||||||
|
2015 |
2016 |
2017 |
2018 |
2015 |
2016 |
2017 |
2018 |
|
|
Gross Margin |
37.97% |
38.82% |
38.64% |
38.95% |
52.75 |
53.39 |
53.77 |
51.29 |
The above gross profit figures clearly states that the gross profit position of Heineken is quite better comparative to Farsons. The cost of sales of Farsons is high due to which the gross profit ratio is low.
Net profit ratio
|
Farsons |
Heineken |
|||||||
|
2015 |
2016 |
2017 |
2018 |
2015 |
2016 |
2017 |
2018 |
|
|
Net profit margin |
10.11% |
13.22% |
13.77% |
14.49% |
4.67% |
3.75% |
4.46% |
4.28% |
As the above evaluation shows the net margin of Farsons states more favourable results than Heineken. The analysis presents that company is effectively able to maintain the net profitability in increasing manner.
Current ratio
|
Farsons |
Heineken |
|||||||
|
2015 |
2016 |
2017 |
2018 |
2015 |
2016 |
2017 |
2018 |
|
|
Current Ratio |
1.72 |
1.39 |
1.39 |
1.12 |
0.69 |
0.78 |
0.79 |
0.87 |
The above table extract the figures related to current ratios for Farsons and Heineken for four years. Efficient current ratio is a result of effective working capital management of organisation and the above figures presents that working capital management of Farsons is quite good that helped the company to maintain an optimistic level of current assets and liabilities. The current ratios states that Farsons have maintain an optimistic level among current assets and current liabilities. Whereas, the current ratio position of Heineken is not as efficient as Farsons.
Return on equity ratio
|
Farsons |
Heineken |
|||||||
|
|
2015 |
2016 |
2017 |
2018 |
2015 |
2016 |
2017 |
2018 |
|
Return on Equity |
12.52% |
10.43% |
10.70% |
8.19% |
14.87% |
11.67% |
14.77% |
13.94% |
The above table explores the return on equity position of both Farsons and Heineken. The ratio elaborates the efficiency of generating returns on invested capital. The aggregate calculation presents favourable results in respect of Heineken as the average ROE is maintained as 13.94% whereas the average ROE of Farsons is 10.46%.
2. Importance Of Assessing The Working Capital
Working capital management of Farsons
The current assets of the organization in 2015 to 2018 were 32, 33, 34 and 36 respectively, while the current assets were 18, 24, 24 and 32 during the same period. The approximate working capital of 14, 9, 10 and 4 million in 2015, 2016, 2017 and 2018 is based on these estimates of current assets and current liabilities. Business has good working capital, but the working capital of the business has been growing (Annual report of SIMONDS FARSONS CISK PLC, 2018).
Working capital management of Heineken
In 2015, 2016, 2017 and 2018, the company announced current total assets of £ 5914, £ 8137, £ 8248, or £ 9070 million overall. While the current liabilities of the company during the same time are £ 8516, £ 10397, £ 10458 and £ 10450 which is more than the estimates of the existing assets of the company. Because of the negative working capital of the company during all four years. Negative cash flow, however, is declining from 2015 to 2018. As in 2015 WC in 2005 was -£2602 and goes on to -£2260 in 2016, -£2210 in 2017 and -£1380 in 2018 (Annual report of Heineken, 2018).
3. Critical Assessment Of The Annual Cash Flow Statement
Cash flows of Heineken
An increase in cash flow statement from net cash or (free free cash flow) of £1.7 billion and a correlating reduce in funding cash flow. Finalization of integrated leases verification. New lease agreements to be signed in 2019. The effect on total cash flow is anticipated to be unbiased due to the completion of the verification of comprehensiveness and accuracy of both the recognized agreements, the actual effect on the financial reports in 2019 is anticipated to be different (Annual report of Heineken, 2018).
HEINEKEN announced a total off-balance sheet investment of £1.7 billion for leases as being at 31 December 2018. The discrepancy between the projected opening balance sheet effect of £1.2 billion (leasing liability) off-balance sheet obligations is largely due to the low-value and short-term lease liabilities not included in the lease liabilities, and the effects of potential lease downplaying. As the Cash and cash equivalents at end of 2017 was recorded as £10025600 and for 2018 £1910800. The cash flows are recorded increased by 90.59% in the year 2018.
Cash flows of Farsons
Financial assets are derecognized once the ability to obtain cash flows from liquid assets has ended or been passed and the Group has passed significantly all equity risks and rewards or has not gained control over the property. Flow estimates of retained earnings over a 12-month span on the basis of anticipated cash flows and guarantees that sufficient funding structures are in place for both the coming year. Using forward market rates at the investigating date, the fair value for forward forex agreements is calculated. The fair value of interest rate swaps is based primarily on the present value of future expected cash flows. Cash and cash equivalents at end of 2017 was recorded as -£1123700 and for 2018 -£2118200. The negative balance of cash flows increased by 88% (Annual report of SIMONDS FARSONS CISK PLC, 2018).
Conclusion
The above data clearly states the concept of financial analysis management and enterprise. The financial data were quite confronting in terms of assessing that which organisation is financially feasible or strong. The report extracts the subject in three ways. The first portion effectively presents the horizontal and vertical analysis of financial statements for the given companies and ratio analysis clearly presents the financial efficiency of organisations. It is effectively interpreted that effective working capital helps in assessing to attain the short term business goals of an organisation. at last the cash flow evaluation of both the companies presents that how management of effective cash flow resources through different cash flow activities helps in managing the hedging risk.
References
- Karanina, E., Bykova, I. and Ilysheva, N., 2014. Management Accounting system and the balanced scorecard: reflecting enterprise risks. Am. J. Sci. Res. 1(14). pp.112-122.
- Zeghal, D. and El Aoun, M., 2016. The effect of the 2007/2008 financial crisis on enterprise risk management disclosure of top US banks. Journal of Modern Accounting and Auditing. 12(1). pp.28-51.
- Farrell, M. and Gallagher, R., 2015. The valuation implications of enterprise risk management maturity. Journal of Risk and Insurance. 82(3). pp.625-657.
- Van Cranenburgh, K. C. and Arenas, D., 2014. Strategic and moral dilemmas of corporate philanthropy in developing countries: Heineken in Sub-Saharan Africa. Journal of business ethics. 122(3). pp.523-536.
- Gatzert, N. and Martin, M., 2015. Determinants and value of enterprise risk management: empirical evidence from the literature. Risk Management and Insurance Review. 18(1). pp.29-53.
- Muscat, D., 2013. Separation of ownership and control in non-bank Maltese listed companies: an analysis (Bachelor's thesis, University of Malta).
- Grixti, I., 2013. Analysing the impact of the transition from an historical cost to a fair value model of accounting for preparers, auditors and users of the financial statements of listed companies in Malta–An island state economy (Doctoral dissertation, University of Southampton).
- Azzopardi, M. and Cortis, D., 2013. Implementing automotive telematics for insurance covers of fleets. Journal of technology management & innovation. 8(4). pp.59-67.

UPTO50%
Avail The Benefit Today!
To View this & another 50000+ Free Sample